800.979.3177
 +1.412.785.7671
Ad Reporting Changes Coming to Facebook

When commenting on the paradox of data in his book Web Analytics 2.0, Avinash Kaushik said, “So much data, so few insights.” Although Kaushik’s book published back in 2010, (for reference, Kylie Jenner was 12 years old, several years before a now-infamous $1.3B tweet about Snapchat) he was perfectly describing the current state of Facebook.
Facebook has an obscene amount of data points on 79% of the U.S. population, extending far beyond your profile information and actions on the platform. This includes every action you take on a site with a Facebook “Like” button, as well as every app that gives you the option to “Log in with Facebook.”

This results in thousands of targeting options and hundreds of metrics for advertisers to utilize. But more data does not equal more insight. Last week, Facebook announced that they would begin labeling metrics that are “estimated” and “in development,” as well as removing 20 ad metrics that they’ve determined to be outdated.
Estimated and In Development Metrics
According to Facebook’s press release, “Estimated metrics are calculated based on sampling or modeling. They provide guidance for outcomes that are hard to precisely quantify, and we may update our measurement methodologies as we gather more data and improve our signals.” What they’re saying is that any insights from these metrics should be treated as directional.
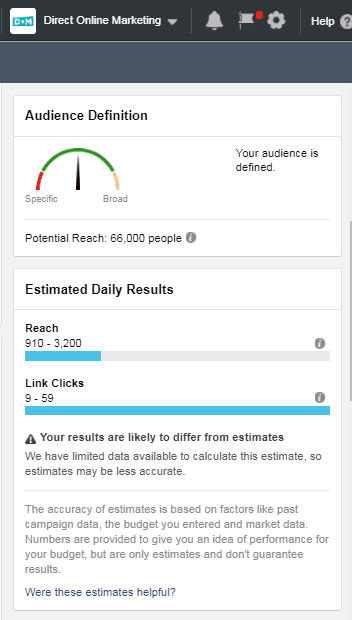
The most obvious shortcoming of these new estimated metrics is that sample sizes that are too small — well below statistical significance — and will likely be inaccurate. Any marketer that has reviewed Facebook’s “Estimated Daily Results” for an ad set with a small audience can attest to this. These estimated metrics should ultimately be met with a healthy serving of similar skepticism.
Removed Ad Metrics
Facebook has also provided a full list of all metrics that will be removed. Here’s a look at the most meaningful metrics that will be removed.
Carousel Card
It’s very concerning to hear that Facebook will no longer provide conversion metrics (ex. Website Conversions) for individual Carousel Cards. This is a minor inconvenience for Carousels where each card is going to a unique product landing page, as you’ll simply have to use Google Analytics to report on conversions.
However, what about Carousels where each card is going to the same page? A workaround would be to manually build unique UTM parameters for each card’s destination URL, then segment by the unique identifier in Google Analytics.
Canvas Component Time Percentage
This metric is the average percentage of time spent viewing each component of a Facebook Canvas. Facebook claims that this metric hasn’t been used widely by advertisers, which was also surprising to hear.

As marketers, its engrained in our DNA to A/B test elements of our ads and landing pages. Let’s say you want to test two Canvas versions — one with a Carousel in the second component, one with a 360° Photo. Now there is no way to measure how users are engaging with these individual components.
Button Clicks
This decision makes sense, as the Button Clicks metric is redundant. Depending on your campaign type, you can use Link Clicks, Event Responses or Offers Saved in place of Button Clicks. While this change isn’t as significant as the previous examples, it is worth calling out, since advertisers may still be using Button Clicks to report across multiple campaign types.
This can be easily solved by filtering by “Objectives” before exporting performance data. Alternatively, if you still need to utilize Button Clicks, you can simply export performance data into Excel, and add a column containing (‘Link Clicks’ + ‘Event Responses’ + ‘Offers Saved’).
Conclusion
Facebook marketers are in a unique position because Facebook is constantly evolving. As the platform grows, it is constantly collecting more data while finding new ways to analyze and display this data.