Pivot Tables: The Unsung Hero of PPC Performance Evaluation
Analyzing your PPC campaigns by location reveals actionable insights. It helps you spend your digital advertising budget more efficiently. Once you discover where your ads are enticing people to convert, you can nurture those efforts. While, on the other hand, you can reduce your spend in places where your ads aren’t the right fit for the audience.
This blog post shows you how to extract location data from Google Ads into an Excel sheet, transform that data into a pivot table, and then manipulate that table to pull out performance insights.
Pivot tables are potent and complex. I hope that this careful, step-by-step example of PPC analysis—complete with (one might even say replete with) screenshots to guide you—will start to demystify pivot tables.
Exporting Location Performance Data from Google Ads to Excel
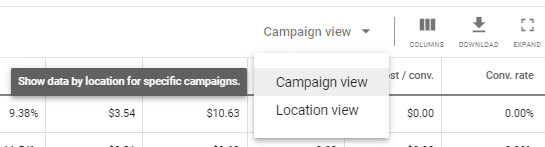
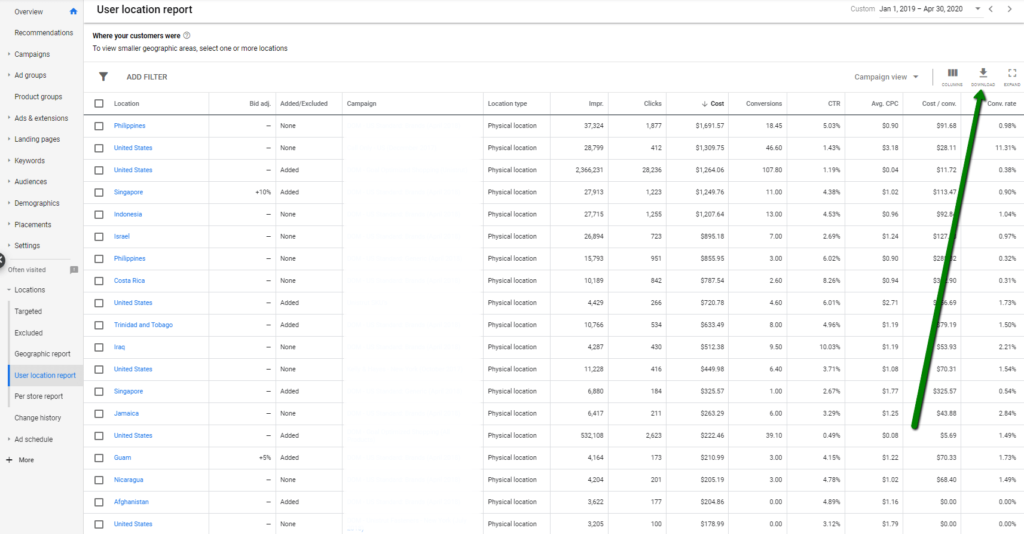
We’re going to extract our data via this path: Locations > User location report > Campaign view > Download
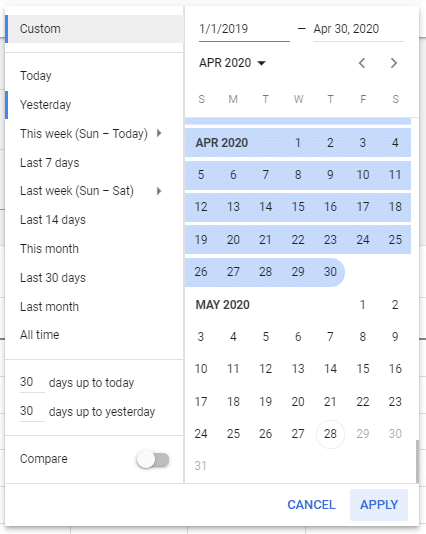
Let’s begin by setting the date range to examine. In the example here, I’m going to look quite far back; I want to take a deep dive into the historical performance of this account.
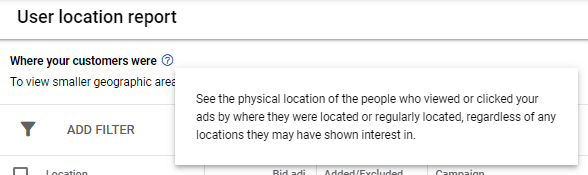
Navigate to: Locations > User location report
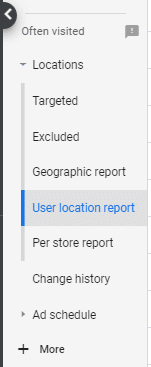
I’m selecting the “User location report” because I’m interested in where users actually were when they interacted with my ads.
The “Geographic report” factors in user interest in addition to user location.
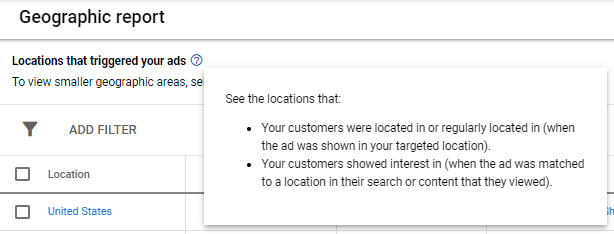
Pick the report that best suits your product or service. For example, a tour company specializing in treks up Mount Kilimanjaro would benefit from knowing when people are interested in Tanzania.
Select “Campaign view,” not “Location view.”
If you select “Location view,” you won’t be able to segment out how each campaign did in each location; you’ll only be able to see total performance, for all campaigns, by location.
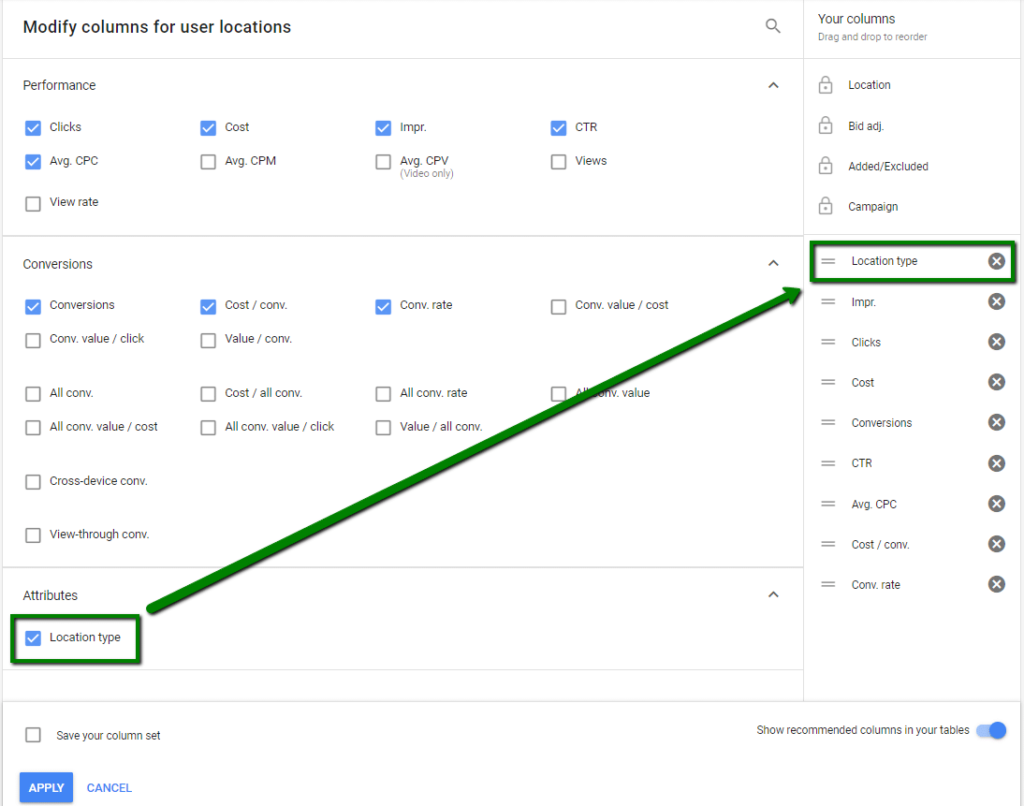
Set your columns for the metrics you want to pull into the pivot table.
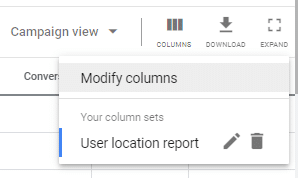
Make sure to include “Location type.”
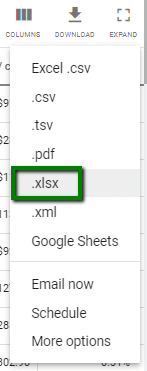
With your desired columns in place, download your data.
I recommend downloading it as a .xlsx file; a .csv file does not support saving advanced Excel elements (like pivot tables). I’ve had my stomach drop one too many times upon opening a file and finding all my work gone.
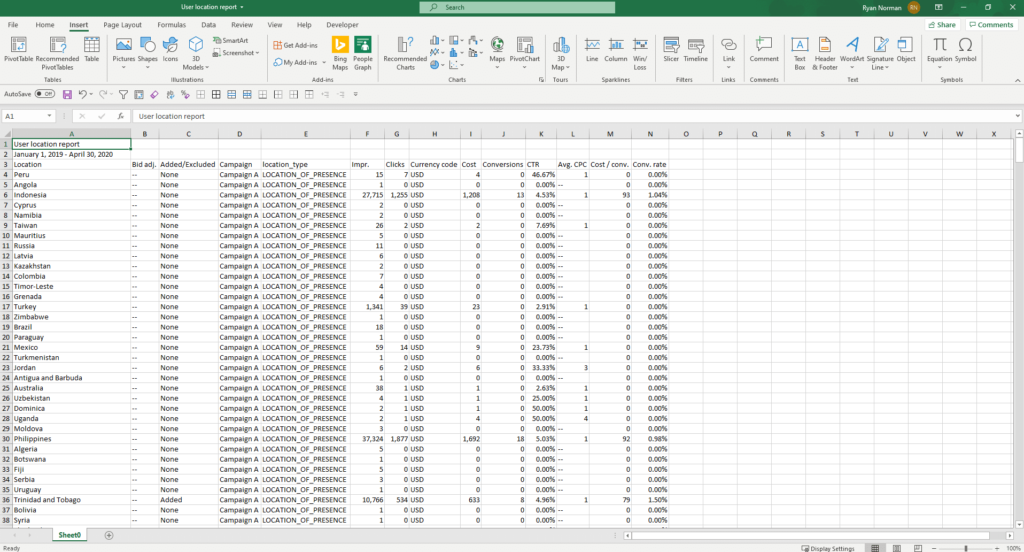
The resulting Excel should look something like this.
Setting Up the Pivot Table
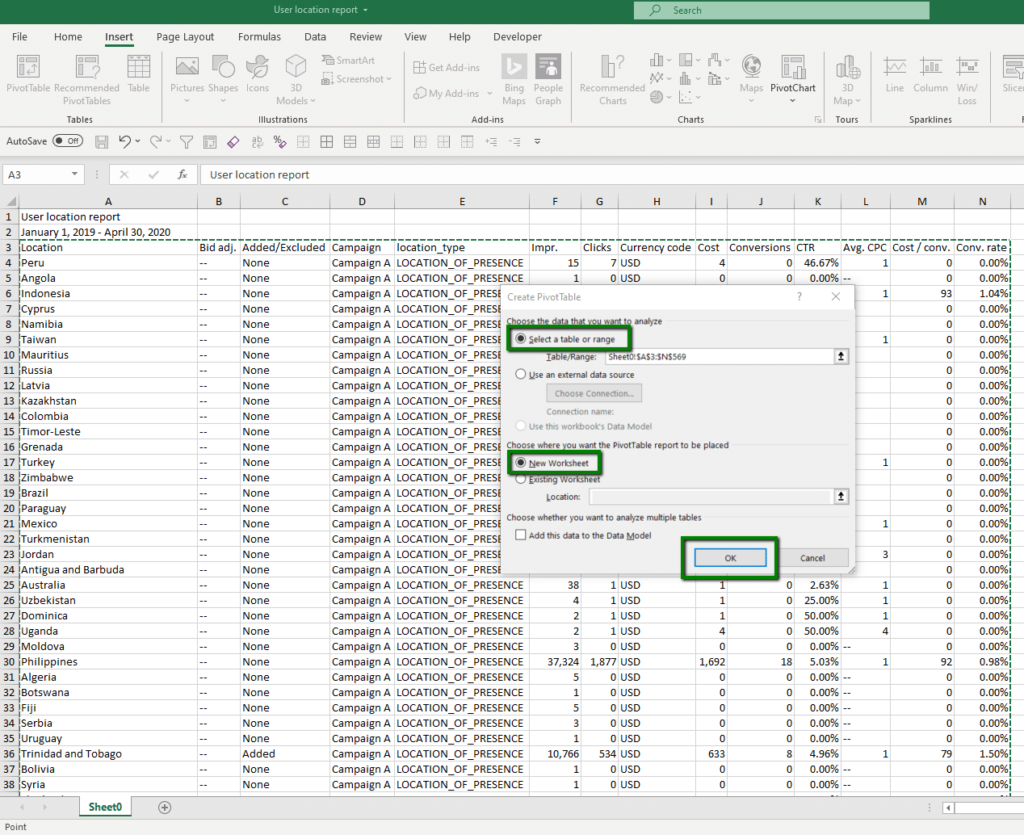
Navigate to: Insert > PivotTable
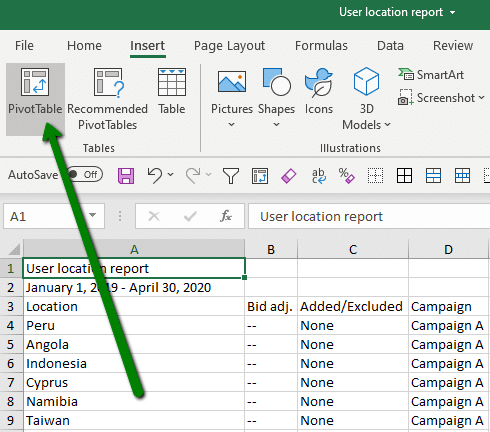
Select the data that you’ve just pulled into the Excel sheet, including column headings.
Choose to place the pivot table on a new worksheet. (I find this keeps your work cleaner, and keeping all your raw data in a separate sheet is convenient in case you need to refer to it or create a new table.)
Click “OK.”
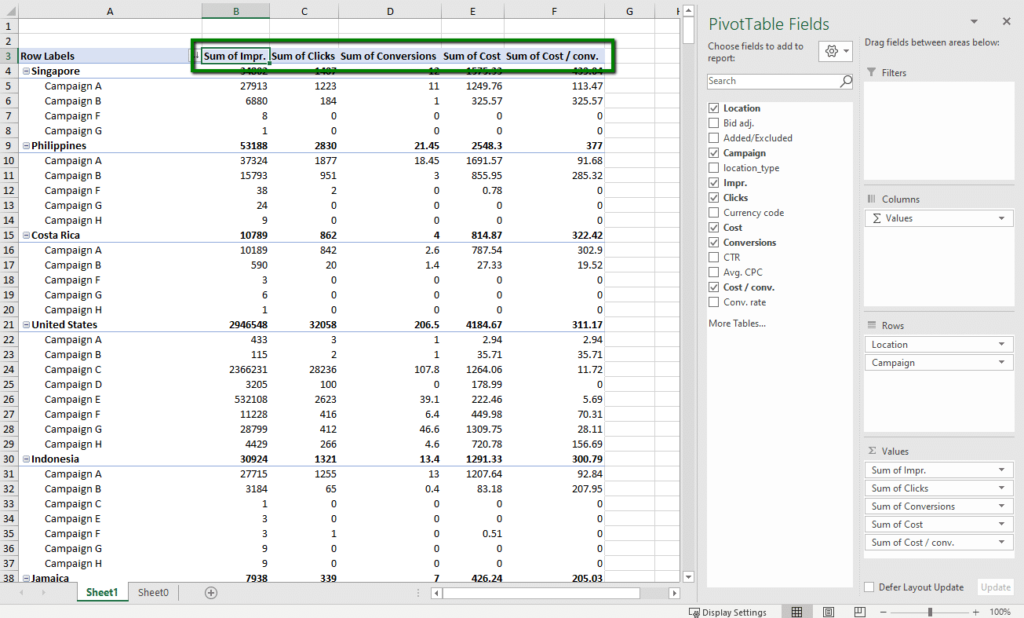
Populate your pivot table fields. You do this by checking the boxes that correspond to the columns you’ve pulled into Excel.
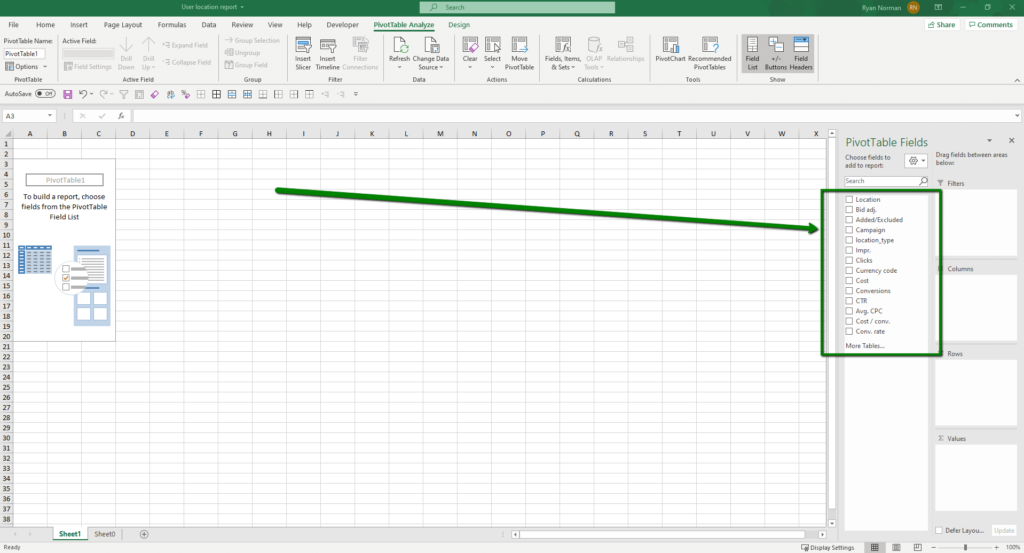
You can then drag the enabled fields between the 4 pivot table areas: Filters, Columns, Rows, Values. Shifting the fields from one area to another adjusts the pivot table for numerous avenues of analysis.
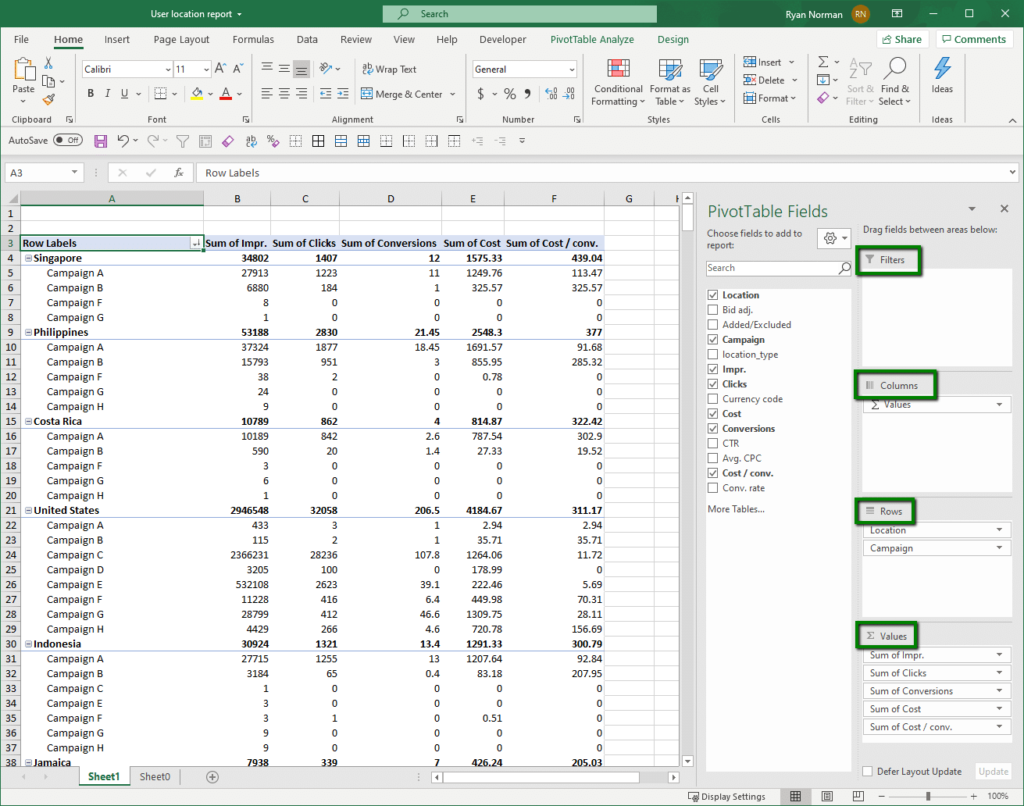
Here, I’m going to analyze how campaigns performed by country (and vice versa) looking at impressions, clicks, conversions, cost, and cost/conv.
Using a Pivot Table to Identify Performance Insights
Pivot tables can be a bit overwhelming. So let me begin with some navigation tips; then we can get to analyzing.
Expanding and Collapsing Your Locations and Campaigns
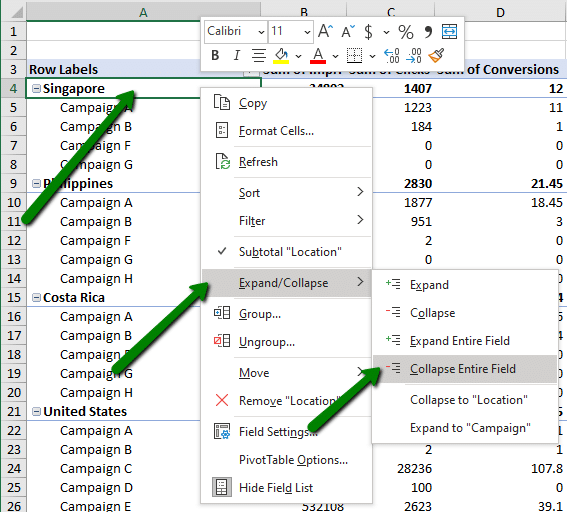
In the screenshot below, campaigns are nested within locations in column A. Being able to expand and collapse your rows is key to identifying general trends and then drilling down for granular performance analysis.
Navigate this path to open and close the nesting: Hover over the column you want to change > Right-click > Expand/Collapse > Collapse Entire Field
Sorting Your Metrics
There are many ways to sort within the nesting of a pivot table. This means there are many possible insights to be gained, but getting your sorting technique down can be finicky.
Where you click within the table to sort is crucial. The process to sort each time will be the same. Paying close attention to the cell you select, navigate this path to sort: Hover over a cell of the level/metric you want to sort by > Right-click > Sort > Sort Largest to Smallest
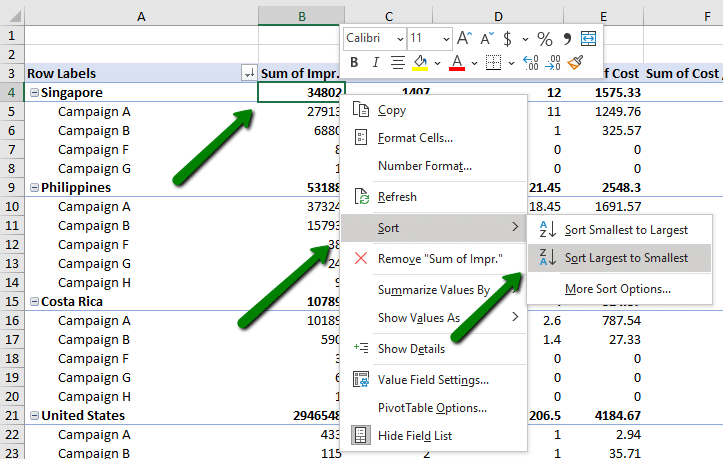
In the screenshot above, I am sorting locations by the total impressions they received from any campaigns. Excel is letting me sort this way because I right-clicked on cell B4, which is on the location level of nesting and under the total of impressions metric.
You can also sort by how the campaigns performed within a location. Starting this same sorting procedure by right-clicking on B5 would have sorted the campaigns nested within Singapore by impressions (and it would have the same effect on all the other campaigns within all the other locations below).
Warning: Don’t sort on column headings.
Sorting by any of the metric headings (here, any of row 3 cells B, C, D, E, or F) results in the rearrangement of your columns by the totals of the various metrics in each column. That is, the structure of your pivot table will likely change, as your metric columns are moved left or right to be in order from largest to smallest total. (You can also see the results of this change in the reordering of your fields within the areas in the panel on the right.)
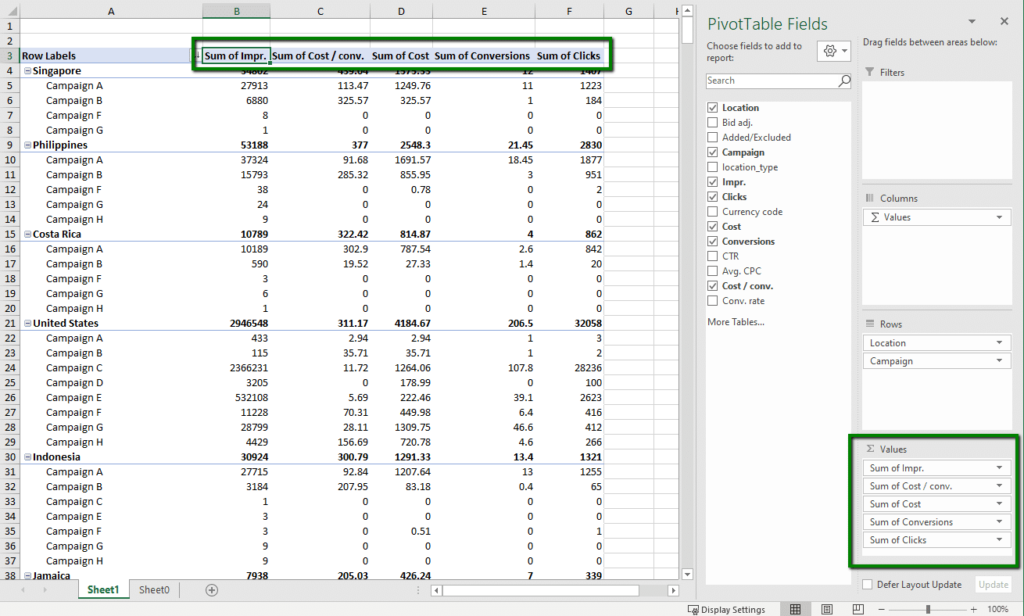
See how C3 is now occupied by “Sum of Cost/conv” rather than “Sum of Clicks”; D3, E3, and F3 have been similarly affected.
Analyzing by Location
This pivot table lets us look at this account from (at least) two perspectives: how well our campaigns did in a particular country, and how various countries contributed to the performance of a single campaign. I’ll begin with the former.
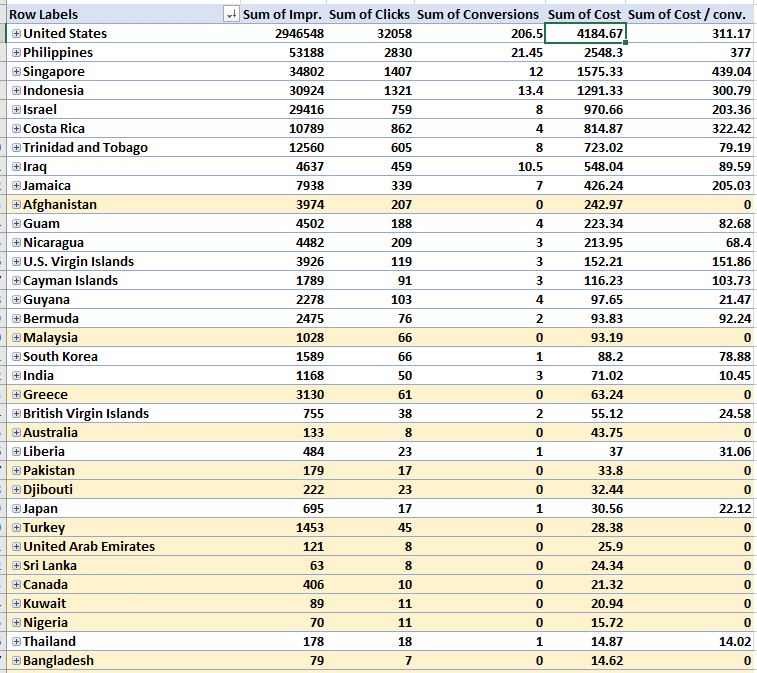
Here I’ve collapsed the campaign level and then sorted by conversions to reveal which locations drove the most conversions.
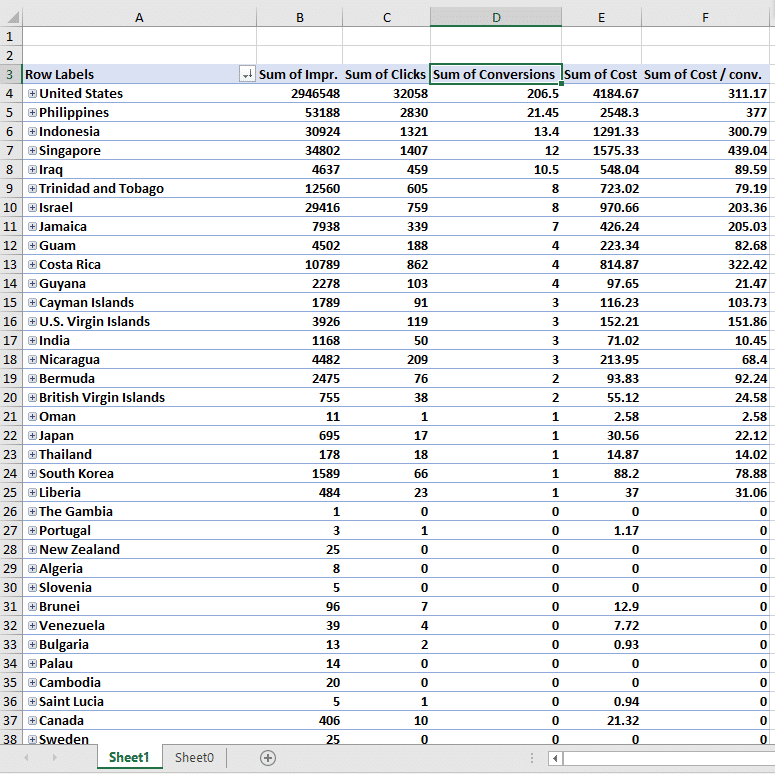
From this, I can see that I want to nurture my efforts towards the United States, the Philippines, Indonesia, Singapore, and Iraq.
What campaigns in particular, though, should I focus on?
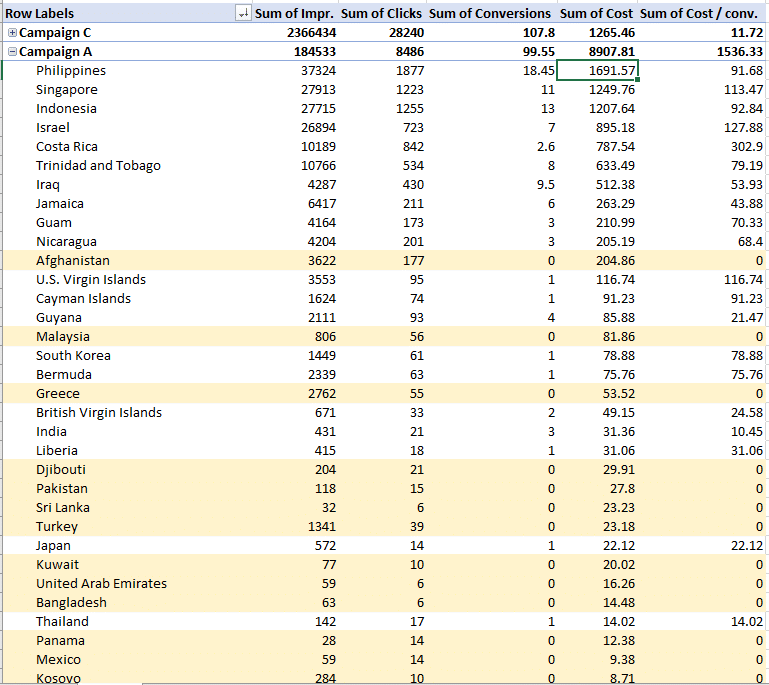
To answer this, I’ll expand the nesting to reveal the campaigns under each location and then sort by conversions by right-clicking on D5.
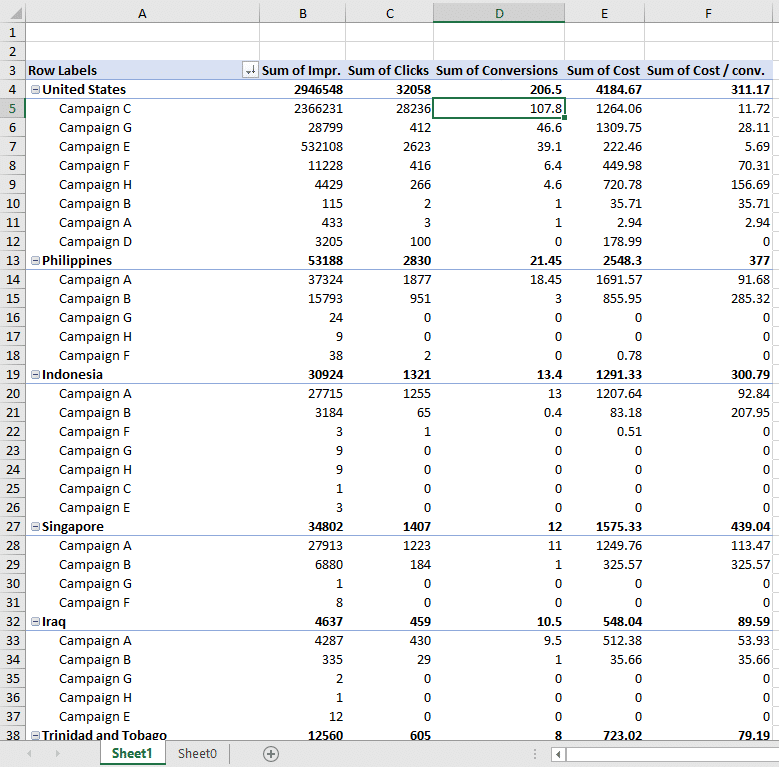
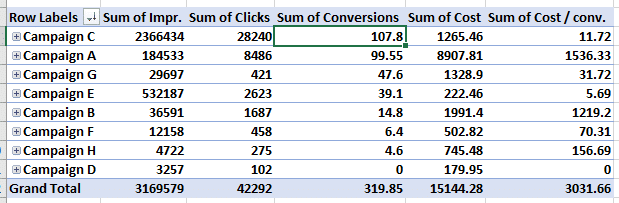
Now I can see that Campaign C has driven the most conversions in the United States and that Campaign A has driven the most conversions in the other 4 locations.
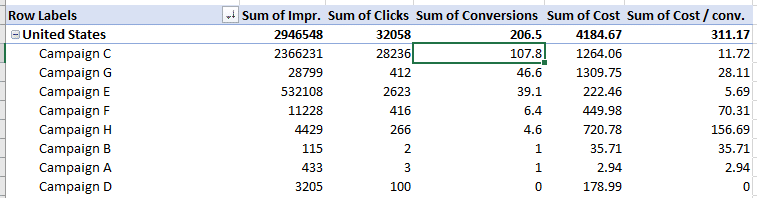
I could also sort by cost/conv to see that while Campaign C has driven the most conversions in the US (107.8), Campaign E has driven about one-fifth (39.1) of all conversions (206.5) in the US for about half (5.69) the cost/conv of Campaign C (11.72). So I’ll want to investigate Campaign C to see what’s going right there and do more of it.
Let’s also identify where there’s fat to be trimmed. When I sort by cost in the US, I see that Campaign H has spent the third-most of any campaign (727.78) for only 4.6 conversions; this campaign might not be worth running at that level of return.
Before I just pause the campaign altogether, though, I should dig into the ad groups and keywords within the campaign to see whether there’s a clear poor performer that can be carefully excised without axing the whole campaign.
See this blog post for how to pinpoint PPC performance changes. It shows you how to take a scalpel, rather than a sledgehammer, to poor performers.
Analyzing by Campaign
Time to switch it around.
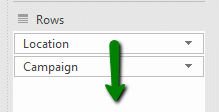
Go to the panel on the right, to the “Rows” area, and move “Location” below “Campaign.” This will reverse the nesting in column A: locations will now be nested under each campaign.
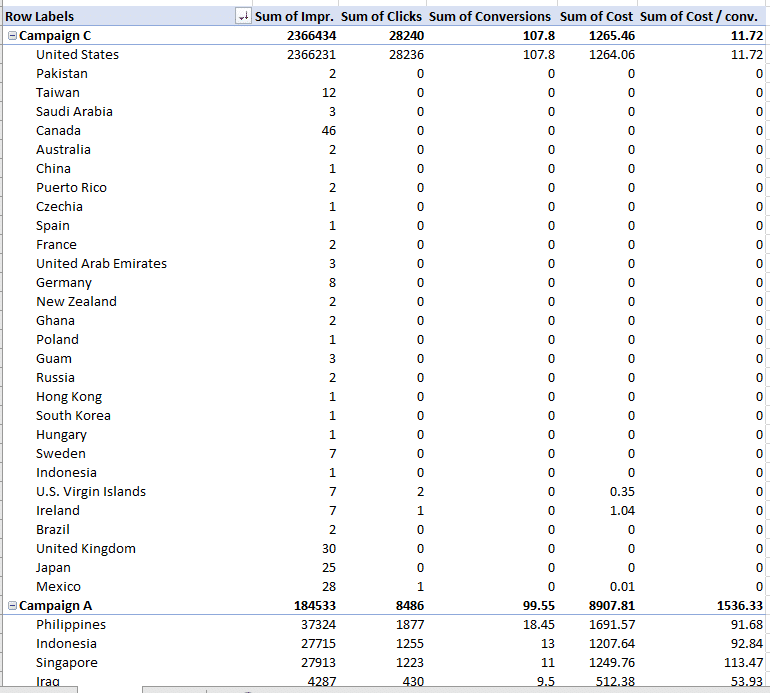
Collapsing the locations reveals the big picture of performance by campaign.
Campaign C has driven the most conversions and at a cost/conv of just 11.72; on the other hand, Campaign A has spent thousands more for nearly the same number of conversions. Let’s investigate.
Here I’ve sorted by cost and then highlighted locations that have not converted in the nearly year-and-a-half that we’re looking at. It might be time to consider excluding these locations from our targeting.
We can also switch back to looking at locations overall and do this same evaluation across all campaigns.
I hope you’ve gotten the flavor of the numerous avenues of analysis that pivot tables open up.
For more help you PPC efforts, check these out:
- How to Pinpoint PPC Performance Changes
- Catch a Competitor Bidding and Ranking for Your Brand? Here’re Your Options
- Now It’s Free to List Your Products on Google
Happy analyzing!