800.979.3177
 +1.412.785.7671
Creating Filters in Looker Studio for Robust Reporting
You need to be proficient with Looker Studio filters – or any data reporting and analysis tools that help you efficiently analyze large datasets – for at least two reasons:
- To show your stakeholders the results of your marketing efforts
- To critically assess the performance of your campaigns in order to identify what’s going wrong and what’s going right so that can make improvements
Plus, generating regular performance reports keeps you accountable. It helps you focus on how you are tracking toward your goals. It alerts you when things start to go off track. And it can even be fun. It is for me anyway; maybe I’m just a little odd.
This article digs into reporting challenges with Looker filters I’ve faced and the techniques I’ve discovered to overcome them. That way, you can scale the hurdles a little easier than I did.
Looker Filters by Campaign Type
I think of campaign type as a way to filter apples from oranges. When you present data, you want to be comparing apples to apples and oranges to, well, you know. (Orange you glad I didn’t say it!)
Filtering by campaign type allows you to clearly display the strengths and weaknesses of different kinds of campaigns. If you just lump all your stats together, you do know how your marketing efforts are performing overall, but you don’t know what campaigns are more effective than others.

To create a report like the one in the screenshot above, you’ll need to create a filter to bring in data for just one campaign type at a time:
- Click on the tile where you will apply the filter
- Click ADD A FILTER
- Select the fields to bring in the data you need

To bring in the data on my display campaigns, I made these selections for my filter:
Include | Campaign Type | Contains | Display
The final field is the key to differentiating by campaign type. In that last field, you enter the name of the kind of campaign you want to pull data in for.
Currently, there are 5 campaign types:
- Search
- Display
- Shopping
- Video
- App

To create the tiles presenting the total data for all campaigns, you can either…
—Use no filter (if you truly want all the Google Ads data available)
…or…
—You can create a filter by campaign type and employ the OR logic to include multiple campaign types
When you want to total up everything that has happened in your account, both of these methods should yield the same results.
If you are interested in being as precise as possible about what campaign types you are reporting on, create a filter like this:

Note the use of the OR operator. This is telling Looker Studio to bring in data for campaigns with the type Search or Display or Shopping. That is, this filter is asking that all 3 campaign types be included.
Be Careful Using the AND Operator
Perhaps counterintuitively, using the AND operator would actually narrow your selection—in this case to show data only for a campaign type that contained Search and Display and Shopping, which is not a campaign type that exists. So you’d end up with an error and no data displaying.

Looker Filters by Campaign Name
Filtering by campaign name is a way to report on multiple campaigns of the same campaign type or across campaign types.
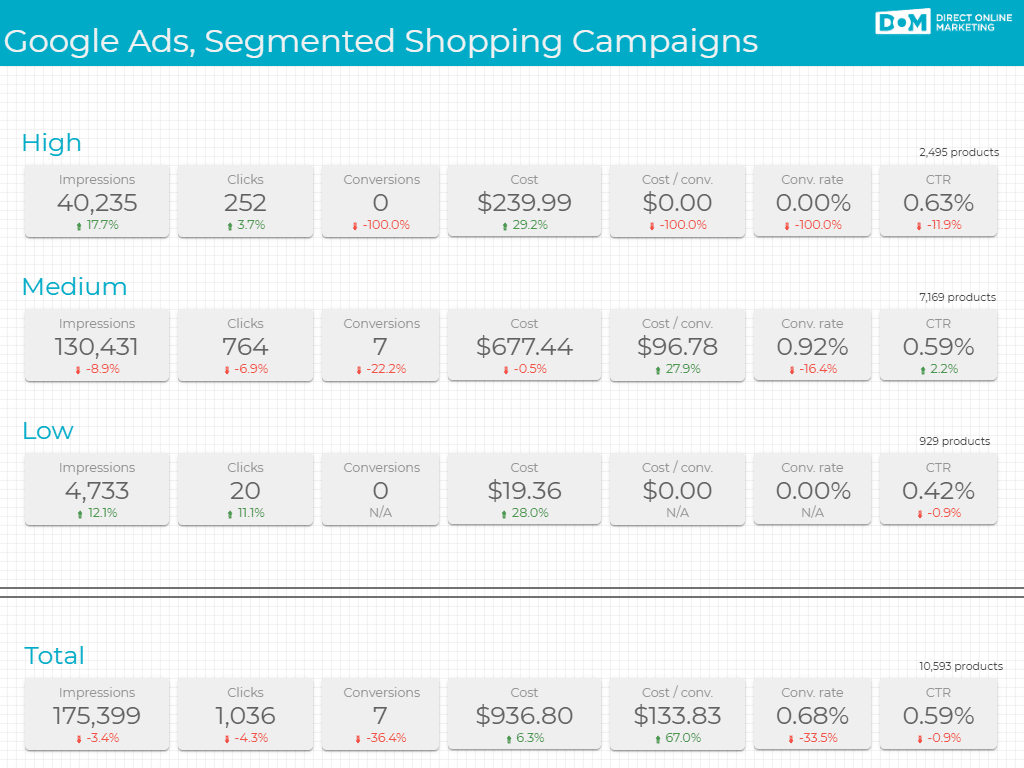
In the screenshot above, I show the total and individual stats for 3 shopping campaigns.
To display the stats of each shopping campaign apart from the others, I applied a filter like this:
Include | Campaign | Contains | High
![]()
(Note that what I’m calling campaign name here in only referred to as “Campaign” in Looker Studio. But be assured that whatever you name your campaign in the Google Ads interface is what you are tapping into with these “Campaign” filters.)
The differentiating factor here is the final bit of text. “High” is the name of the campaign as defined in Google Ads; similarly, I used “Medium” and “Low” in my definitions for the other two filters.
Then, the total row can be generated either by a filter that employs 3 definitions joined by OR, or it can be generated by creating a filter for a campaign type of shopping.
Looker Filters by Campaign ID
Filtering by campaign ID gives you the most control over the data you are bringing into your reports.
By using a unique number that Google assigns to campaigns in the background, you can select just the campaigns you want to report on. This proves to be useful in intricate account structures where trying to filter by campaign name or other methods may fall short (about which more below).

For example, in this view I report on 3 campaign types (Shopping, Display, Search), with 5 groupings of search campaigns (Branding, Featured, Base, Intl, Spanish) each on their own shared budget.
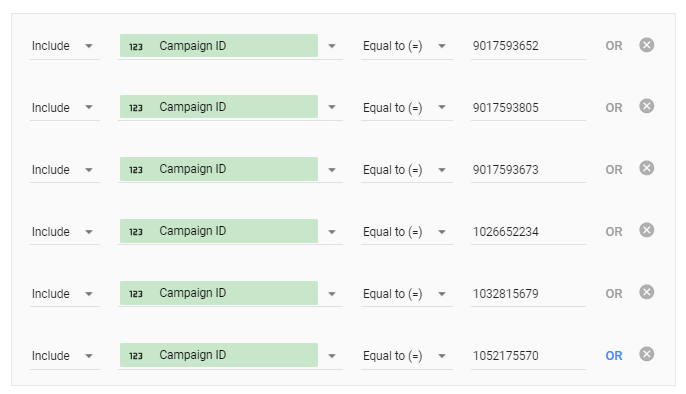
To pull in the data for just the 6 featured search campaigns, I created a filter that employs campaign ID and joins clauses with OR:
Include | Campaign ID | Equal to (=) | #####
Finding Campaign ID
But where the heck is Campaign ID? I’d never seen it before in Google Ads. It took some digging to find.
Campaigns > Columns > Attributes > Campaign ID

![]()


Only 10 Clauses Are Permitted Per Filter In Looker Studio Controls
Looker Studio will only allow you to make filters with up to 10 lines of instructions (referred to as clauses).

I learned this one the hard way. I was chugging along making Looker Studio filters by campaign name when I realized that I had more campaigns on my hands than slots in the filter.
So to remedy this, I developed an ingenious (if I may say so myself), though clunky, series of characters to append to campaign names in Google Ads.
Branding campaign
brsb
Featured campaign 1
f1sb
Featured campaign 1
f2sb
Featured campaign 1
f3sb
Base campaigns
vbsb
International campaigns
visb
Spanish campaigns
vssb
With these characters appended to the multiple campaign groupings in place, I could then pull in the campaigns that I needed via filters like this:
Include | Campaign | Contains | vssb
So problem solved, right? Well, yes, but those strings of characters also then showed up in the Google Ads platform and in Google Analytics, as tails on all my campaign names. It junked up the way things look and threw the client for a loop when they first saw it.
I was able to find a more elegant solution with some advanced filtering.

Here, with 9 clauses (bumping right up on the limit of 10, remember), I was able to narrow down to just the campaigns I wanted to bring in.
Note that in this case, because I wanted to narrow down my selection, I used AND to join the lines.
A Little Review On Looker Studio Filter Control
Let’s zoom out for a moment and review what’s going on in Looker Studio when we filter.
When you ask Looker Studio to display a metric for your Google Ads data, it starts by throwing the kitchen sink at you. You get every impression across every campaign in your whole account, for instance. And that’s great to know, but you need to drill down on performance in order to discover campaigns where performance can be improved.
In the 9-clause filter above, I exclude everything except for my target: the dozens of search campaigns that I refer to as the base campaigns.
Once I realized that I couldn’t just include all the campaign IDs individually (because there are more than 10), and because I couldn’t add the campaigns by campaign name (for the same reason), and because I couldn’t just append a unique character sequence to names of the campaigns that I wanted in the same group and then filter by campaign name on that unique sequence (because of inelegance and junking up Google Ads and Analytics with tails on the campaign names), it was down to some crafty filtering.
Pfew.
Paused Campaign Data Will Be Displayed
Another hard-won lesson I took away from putting together this reporting is that Looker Studio displays the data of paused campaigns.
When I said it gives you everything, I meant it. So you have to be cognizant of the date ranges you report on and when you have made major campaign changes, such as launching new campaigns and disabling or pausing poor performers.
Takeaways on Looker Studio Filters
Filters help you report accurately and precisely while helping identify areas for improvement
- Filter by campaign type to see the broad divisions in your account:
Search
Display
Shopping
Video
App - Filter by campaign name to report on campaigns across multiple, or within a single, campaign type
- Filter by campaign ID to bring exactly the campaigns you need; find campaign ID here:
Campaigns > Columns > Attributes > Campaign ID - Only 10 clauses are permitted per filter
- Use the AND and OR operators with care
- Paused campaign data will be displayed
Take your reports to the next level with FREE Looker Studio templates.
To get more information on this topic, contact us today for a free consultation or learn more about our status as Google Partners before you reach out.