
 800.979.3177
 +1.412.785.7671
Which Site Speed Tool is Better? Google PageSpeed Insights vs Pingdom (Updated 2025)
As good stewards of the websites under our purview, we track a series of vital metrics and make our recommendations based on verifiable data. One of the most important of these, especially since the Core Web Vitals update, is how fast a webpage loads.
Here at DOM, we typically default to two tools – Solarwinds’ Pingdom page speed tool and PageSpeed Insights from Google.
That said, there are plenty of options for evaluating your website speed. Tools like GTMetrix, YSlow, or Uptrends still have value, depending on your needs.
However, one thing that can’t be debated is that Google continues to use page speed as a ranking factor in 2025, and for good reason: if your site is slow, users won’t stick around, and search engines will notice.
Considering that’s exactly the opposite of what we want as SEO professionals, we use a couple of important tools to speed. We wanted to know and maybe you want to know, too: which is better, PageSpeed Insights vs Pingdom?
One Good Tool Is Good, More Is Better
We use both tools as part of our SEO site audit processes. The most common implementation is to use Google’s insights tool as the default with the backup use of Pingdom if a page doesn’t have a lot of traffic. Both have their benefits.

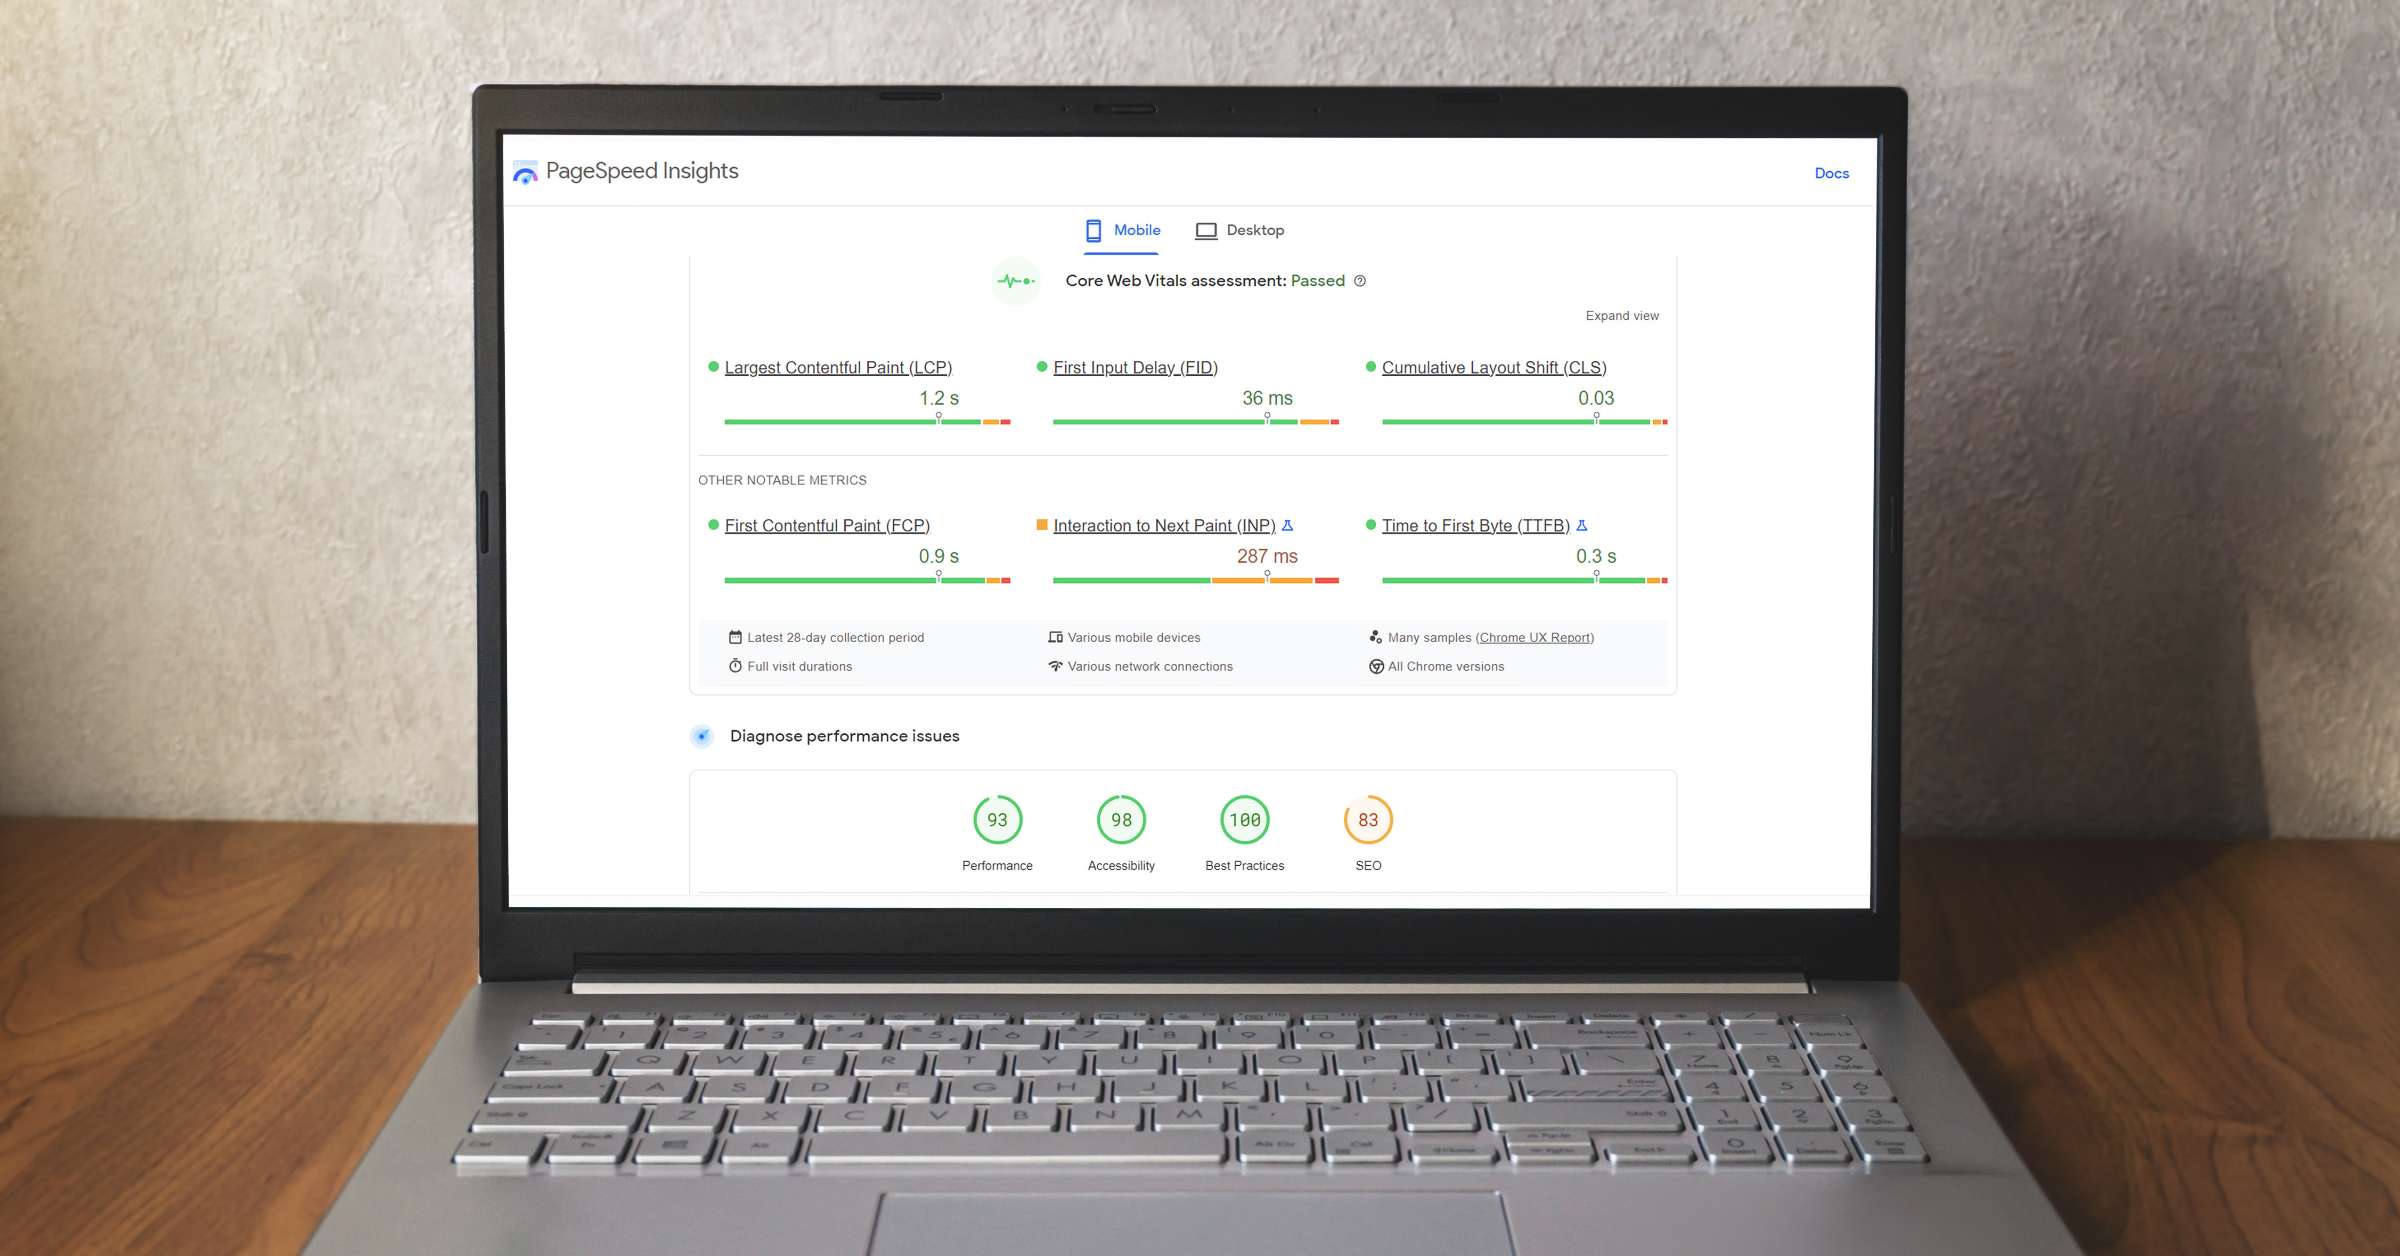
What Is Google PageSpeed Insights?
If there’s an official tool by Google, we’re going to use it. After all, their search engine is the one we want to rank for.
And we don’t need to cite data here to prove that it’s the top search engine in the world—okay, fine, here you go: according to statista.com, Google has 86% of the search engine market share.
Google’s tools are always going to give us the most accurate data as it relates to metrics that are important to Google. If the metrics matter to Google, then that means the metrics are important to us. Contentful paints, input delays, layout shifts, all of them.
As long as it has so much of the search volume, supplying a gargantuan share of the organic traffic on the internet, then we would be silly to ignore it. That’s why we still regularly use Google PageSpeed Insights in our SEO audits in 2025.
![]()
Pingdom Page Speed Test
You might be wondering why we would use anything other than Google PageSpeed Insights, if the results we get from it are so valuable. We don’t do anything without data, and that’s where Pingdom helps us—it provides good data, sure, but it also has a bonus feature that Google doesn’t: geographic transparency.
The primary measurement of page speed is called ping time, which is another term for latency, or how long it takes for the data to go from your device to the page you’re visiting, and then back to your device.
We don’t know the actual source of Google’s site speed measurements, whereas Pingdom, on the other hand, tells us exactly where its servers are.
That’s good because, even in this age of fast-as-light data transfers, distance still matters. A page that is hosted in a location thousands of miles from a person visiting it is prone to higher latency, or ping time. After all, we haven’t invented a technology that can move faster than light.
Not only does Pingdom tell you where the servers are, it lets you choose which server to use in your latency tests. That’s something Google doesn’t offer, and it can be really useful when your website’s traffic tends to come from one specific place. You can also use Pingdom to find out whether the site speed differences you might be seeing are geographic.
Pingdom, of course, is just one of a “comprehensive set of turnkey infrastructure integrations” from Solarwinds. Without getting too promotional for this solution, Pingdom also has additional products to do transaction monitoring, alerting, and more.
Pingdom vs. Google PageSpeed Insights: Onload Time vs Time To Interactive
Onload Time (a Pingdom page speed metric) factors in that some elements on the page may not load before the browser requests it—like a JavaScript-based image carousel. While things like browser caching and lazy loading of images are great, this setup can create a false sense of security for marketers because Pingdom will often report faster page load times than what a user actually experiences.
This is especially true on sites with high mobile device usage and sites with a global reach to areas reliant on 3G or slower connections for internet access.
Time to Interactive (Google’s metric) is the amount of time it takes the page to fully load every element and function. You have more extreme timings in these reports, but you also have a more honest look at how long it can take for a user to gain access to the complete site experience on a device.
Instead of Google’s Time to Interactive metric, a better comparison for Pingdom’s Onload Time metric is Google’s Speed Index metric.
Here’s a comparison of those two for a random page on the internet.
- Pingdom Load Time: 3.69 seconds
- Google PageSpeed Mobile Page Speed Index: 16.2 seconds
- Google PageSpeed Desktop Speed Index: 5 seconds
Clearly, the desktop results from both Google and Pingdom are much closer to each other. But we’re also seeing a pretty wide gap between the desktop experience and the mobile experience.
How does that happen?
Why Google PageSpeed Insights and Pingdom Show Different Results
The leading theory, and one that seems to match the data, is that Pingdom likely uses a real-world browser simulation to do its speed testing and page evaluation. While Google PageSpeed Insights uses an emulated browser in situations where there is no field data or lab data collected in Google Chrome.
That emulation can cause a discrepancy that is important to keep in mind.
Pingdom or Google PageSpeed Insights? Which Website Speed Test Tool Should You Use in 2025?
The answer… is both! We told you from the top: we use Google PageSpeed Insights most of the time, and Pingdom page speed is great for filling in the cracks that can appear.
Of course, there are other options out there in the market for page speed testing. We would be short sighted to not acknowledge tools like GTMetrix, YSlow, Uptrends, and a variety of other proprietary and open source solutions.
As with so many measurements, you’re almost always better off relying on more than one source for your web performance data.
Of course, neither of these free to use tools are a replacement for getting real user insights in real time. But both can be a great place to start if you want some easy pointers on improving page performance and the timings of delivery for your site.
To get more information on the topic of website speed, we have multiple resources for you to check out.
- Are Your Site Pages Up To (Google) Speed?
- Core Web Vitals Update: It’s Coming (Eventually)
- How To Tell If Your Website Load Times Are Hurting Your Business
- How To Crush Your Unminified JavaScript And CSS Issues In Site Audits
Or, if you’d rather just speak to someone about how to make your mobile and desktop pages faster, you’re welcome to contact us today for a free consultation.
Not quite ready to speak to us? No problem, you may want to start out by learning more about our status as a Google Premier Partner and what that means for you.


