Editor’s Note: Looking for information on how to track engagement on your GDS reports using Google Analytics? Are you still using the traditional version of the platform – Universal Analytics? You are at risk of losing any of your historical performance data in 2023 if you don’t set up and properly configure Google Analytics 4. Learn how the two platforms compare to each other in this blog post – Google Analytics 4 vs Universal Analytics.
How to Implement Tracking and Interpret Data for Actionable Insights
Yes, you can use Google Analytics to track your client’s interaction with your Looker Studio reports – just like you would track your website visitors. In this article, I will touch on how to do this (hint: its pretty simple) as well as the importance of the information you can gleam from the resulting analytics reports.
As usual in my articles, let’s get right to business.
How to Configure GA to Track Report Engagement
Create a Looker Studio Report
There are plenty of free templates for Looker Studio reports across the web. If you are new to using Looker Studio, I would recommend grabbing one of these. I wrote an article a few months ago featuring some of our free Looker Studio Templates here.
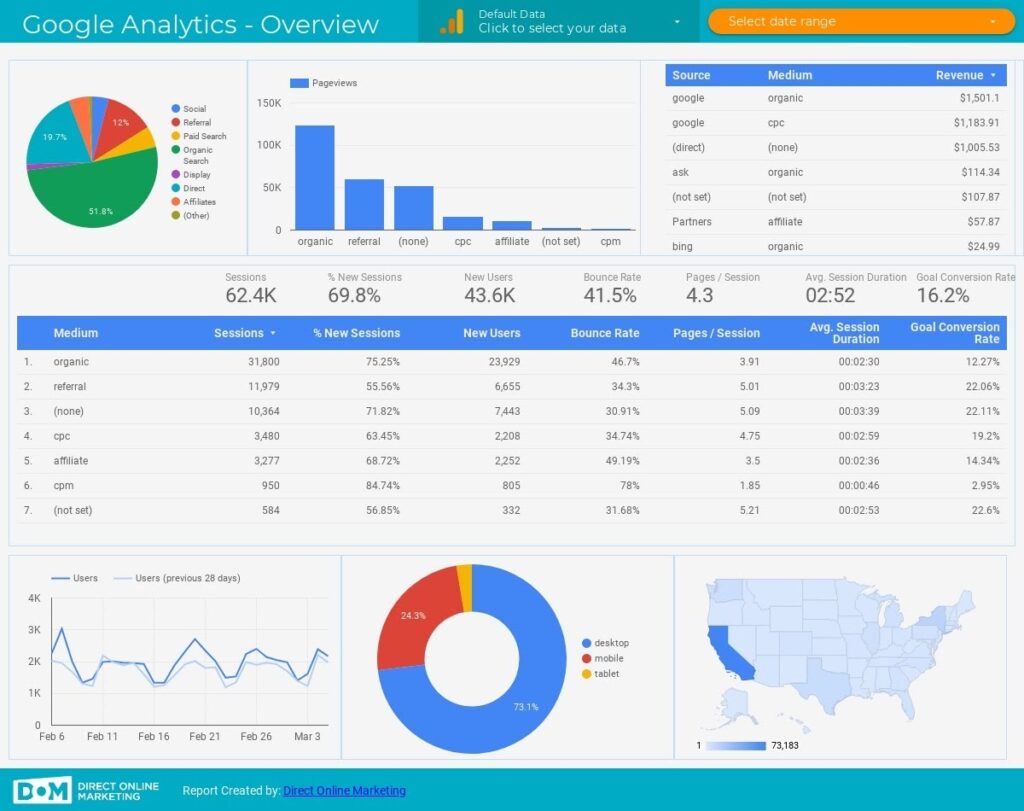
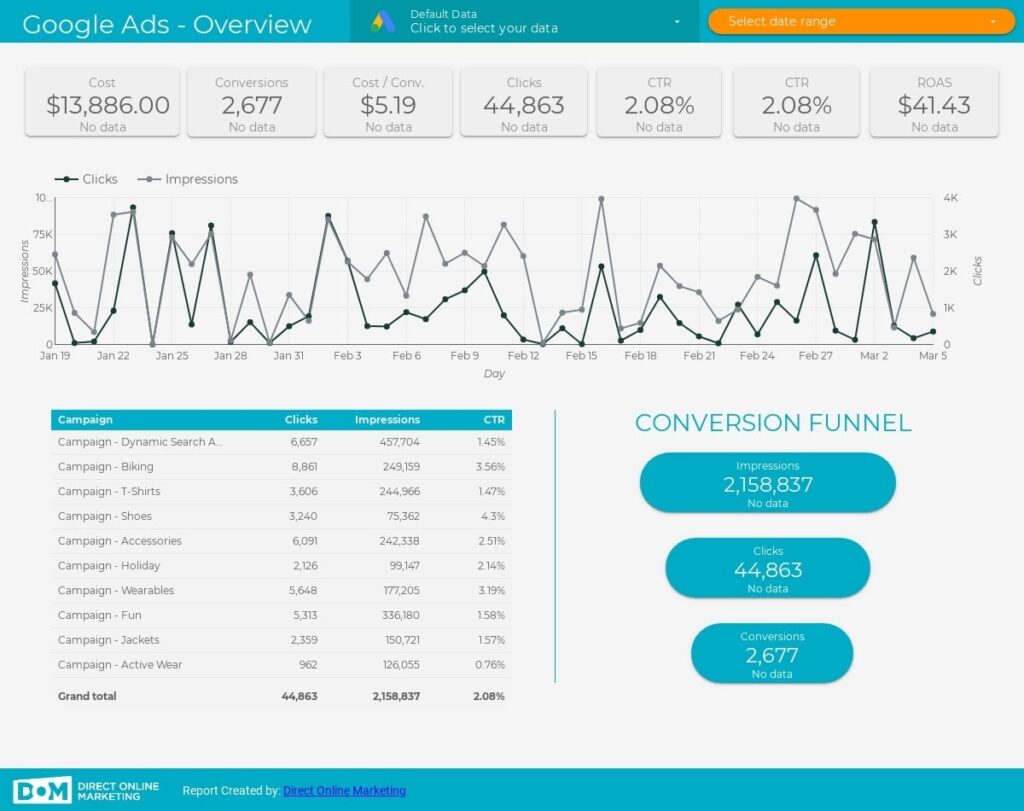
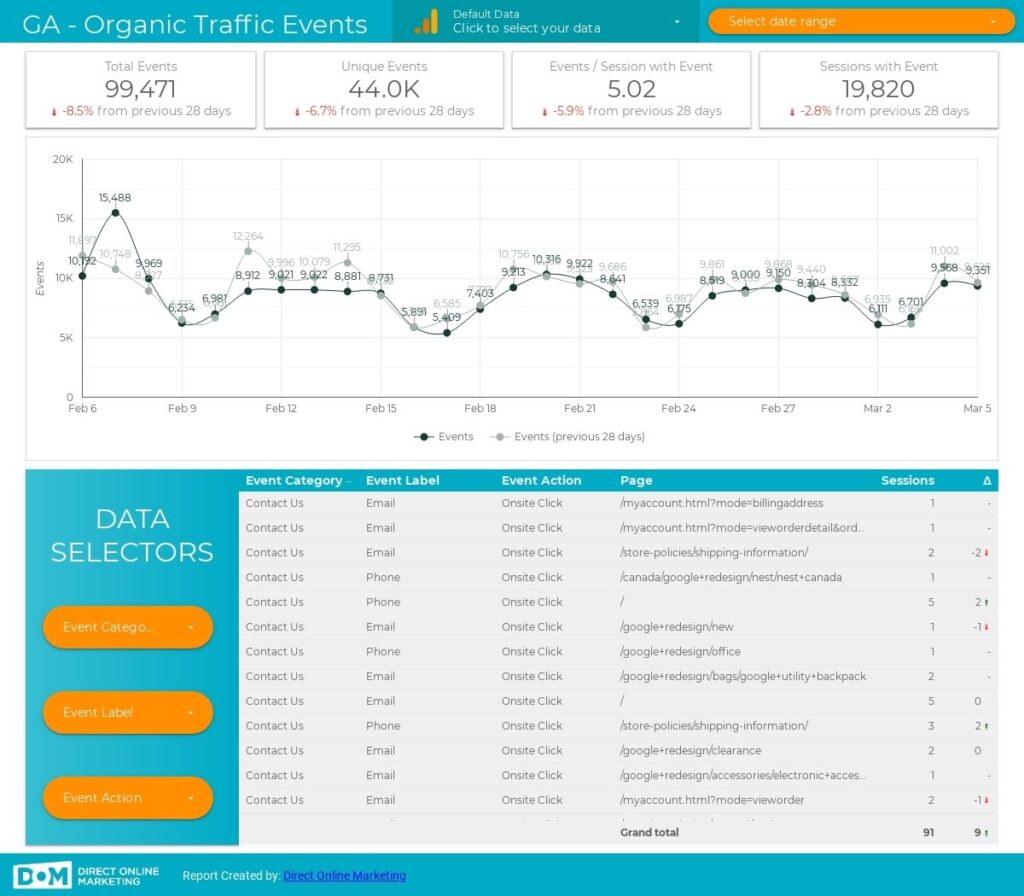
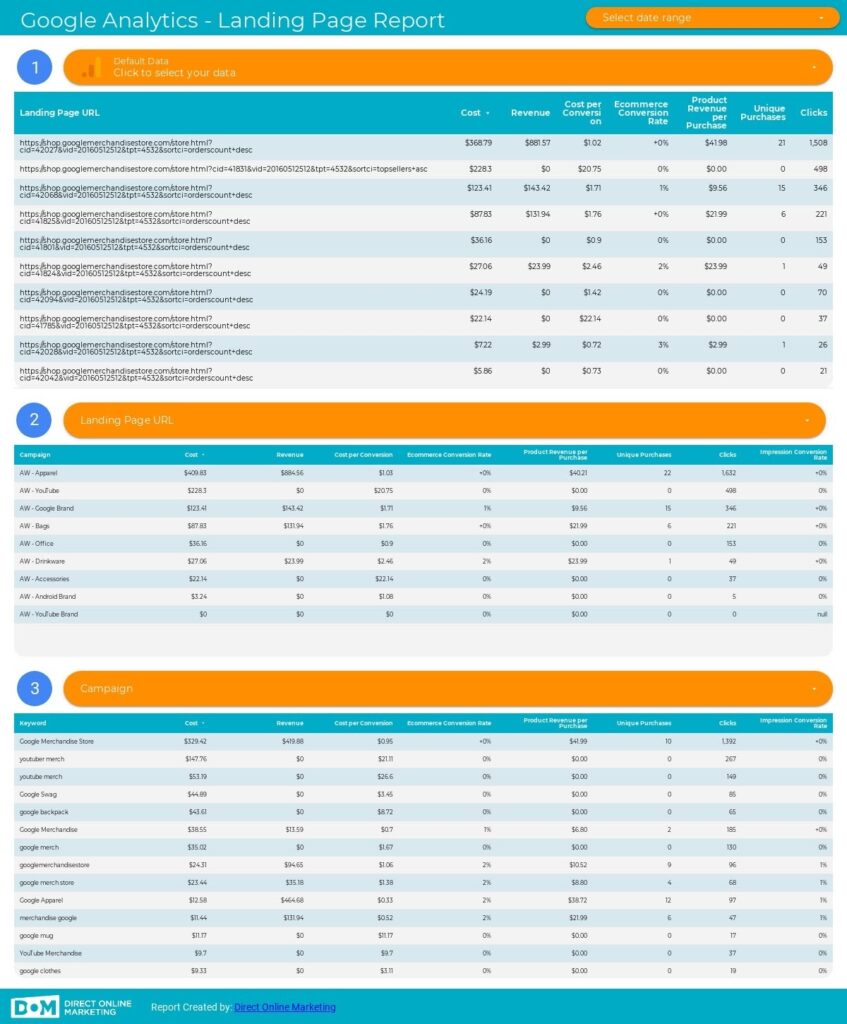
Save time and optimize more by using the following Looker Studio templates. Click the image to jump to that section of our free Looker Studio templates article.
Set Up Google Analytics for Looker Studio Report Tracking
I send out quite a few Looker Studio reports due to our substantial client load. In the name of less clutter within my GA accounts, I decided that creating a separate GA account for all client’s report tracking would be the best way to go. I recommend that you do this as well. To create a new GA account and set it up for DS report tracking, do the following:
- Navigate to www.analytics.google.com
- Click the cog in the bottom left-hand corner of the screen to access your admin section
- Next to Account, click “+ Create Account”
- Name the new account. I named mine “Looker Studio Reports Tracking”
- Click Next, select Web, Click Next
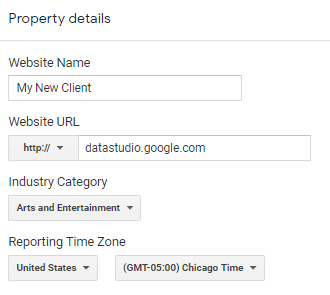
- Fill out the property details as follows:
-
-
- Website Name: Your client’s business name or any unique identifier
- Website URL: http: datastudio.google.com
- Industry Category: Select any of the options
- Click “Create”
-
- You will be taken to a page that contains your GA tracking code. It will look something like UA-XXXXXXXXX-X. Copy this code. If you accidently navigated away from this page, you can find your tracking code by going to the admin section of GA > Property > Tracking Info > Tracking Code.
- With your UA code copied to your clipboard, navigate back to your Looker Studio report.
Set Up Looker Studio for Tracking
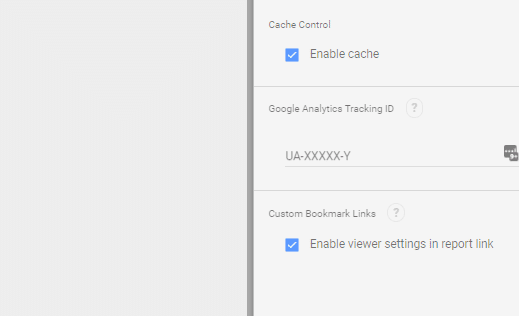
Make sure you are in edit mode and navigate to File > Report Settings. Here you will find a section to paste your UA code titled Google Analytics Tracking ID. Paste your code in this bod and close out of the Report Settings window. You can now share your report with your client.
How to Interpret this Data for Actionable Insights
It may seem obvious why this data is important, but I’m not just saying that; it’s extremely important and there are some complexities involved that might not meet the eye at first glance. If you are a regular user of GA (and I assume you are since you have made it this far), its likely that your gut reaction was to skip this section of the post, but let me point out a few key differences in how I have come to interpret report engagement metrics in GA vs conventional website traffic engagement metrics.
The information being digested by a visitor to your website is static. You have no way to change this information, better explain yourself, or dynamically respond to your website visitor in any way – unless they reach out to you. The best you can do is observe a cohort of visitor’s engagement with your website and make changes that alleviate any similar pain points that future visitors may have. It is important to remember that this is not the case with Looker Studio report engagement. Yes, the numbers are being reported in GA and in the same format, but you can personally reach out to your client when you extrapolate their pain points.
Example Client
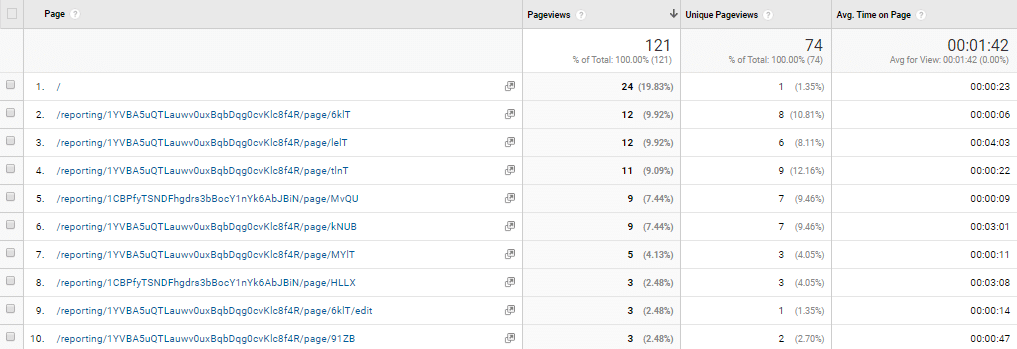
This was one of the very first clients for whom I implemented Looker Studio tracking. It was immediately apparent how game changing GA tracking was going to be for our business. This client came to us specifically asking for help with technical on-page SEO. Here is the data that I observed from their report engagement over the first few weeks:
Note that you can click the icon in your own reports to see which page of the report that confusing Looker Studio url is referring to.
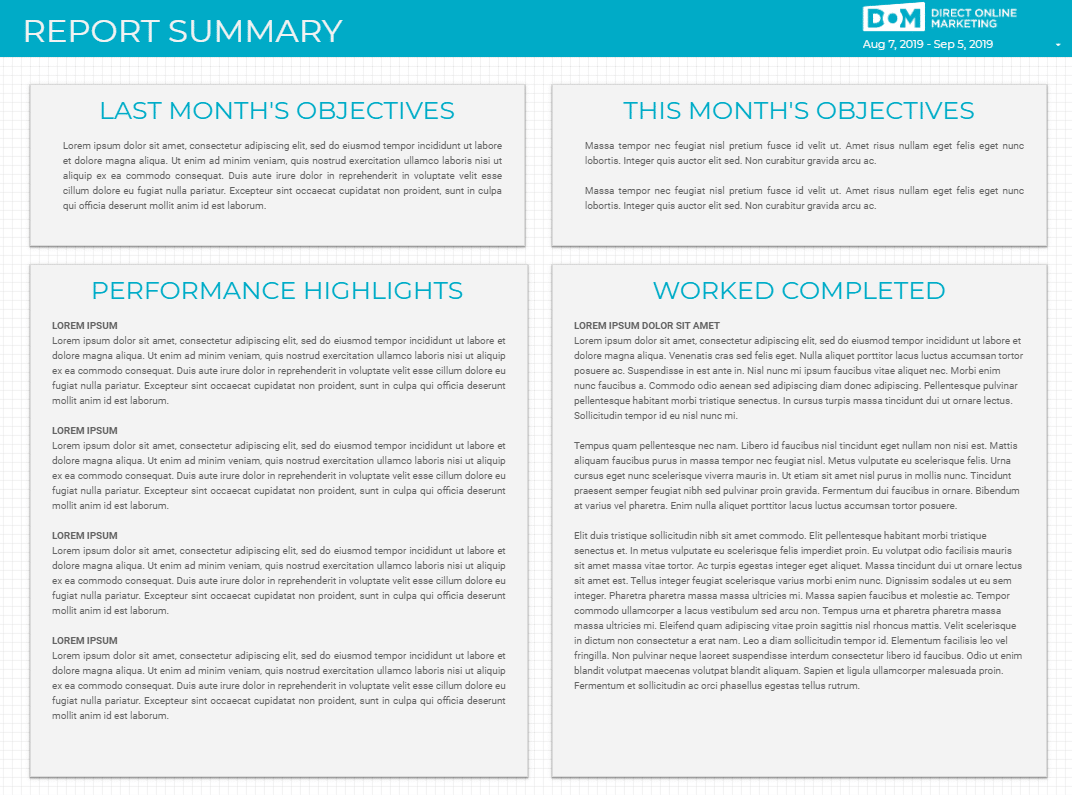
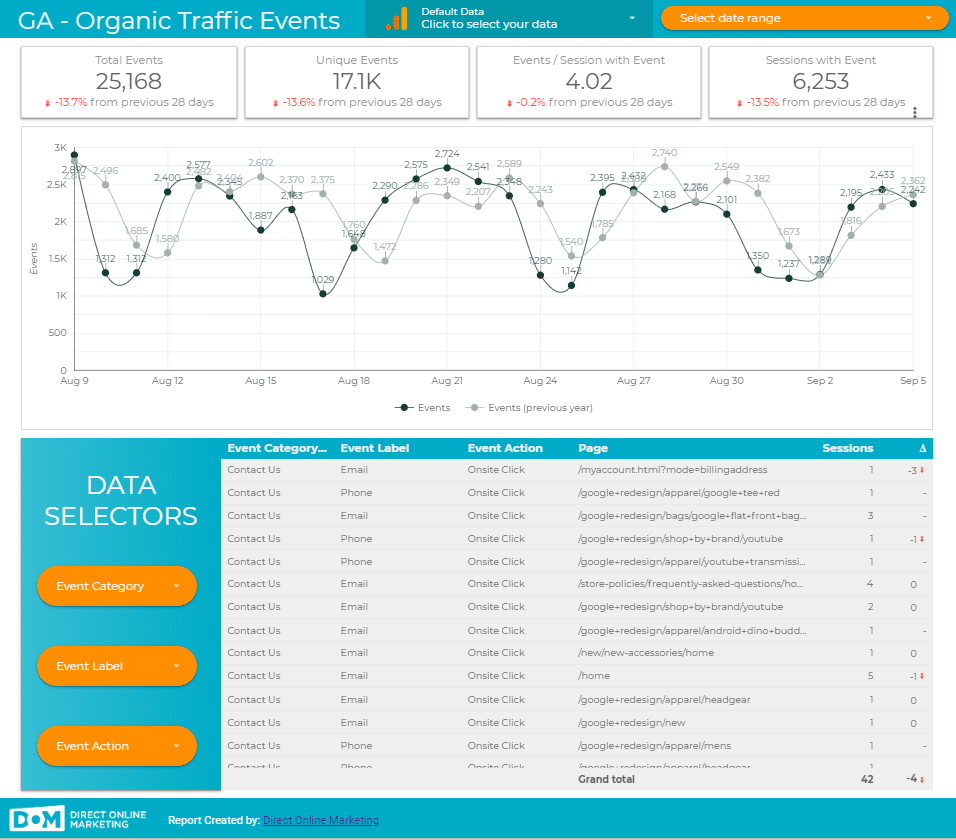
Here is what I noticed from this data: The client had spent a total of 1.2 minutes reviewing our detailed text report on technical SEO updates (see Page #2 above) while spending over 24 minutes on the year over year performance comparison chart (see page #3 above).
| Sample Report Technical Summary | Sample Report Y/Y Analysis |
 |
 |
We immediately reached out to the client to clarify what their overall objective in hiring us was. It turned out that they wanted more traffic, a primary objective that (given their industry and the timing), was different than their stated objective of optimizing their technical SEO. We explained ourselves to the client and as a result, we pivoted our strategies into a bit more content generation and promotion as well as adding a bit of focus on CRO and quality landing page content.
Conclusion
Looker Studio has changed the game when it comes to performance reporting for digital marketing. Alongside report engagement tracking, I see it as an absolute essential for every successful digital marketing agency. If you have any further questions, please feel free to reach out to me via LinkedIn or us via our contact page.
Just getting started with Looker Studio? Here’s a few more links for you to check out and learn more.
- Creating Filters in Looker Studio for Robust Reporting
- Track Looker Studio Report Engagement with Google Analytics
Want to be able to use your data to make better decisions to help grow your business? Learn more about our expert Google Analytics services here.
To get more information on this topic, contact us today for a free consultation or learn more about our status as Google Partners before you reach out.
