800.979.3177
 +1.412.785.7671
How To Understand and Avoid Metric–Goal Distortion
This blog post discusses a concept that may be useful to have in hand for life in general and for digital marketing in particular: metric–goal distortion. Below you’ll learn how this idea applies to grading systems in school, digital marketing campaigns, and general business practices. You’ll hear from the experts at DOM about the pitfalls of focusing on a single measure of success, as well as the promise of a holistic approach.
Metric–Goal Distortion
We set a goal.
We set a metric to track progress toward the goal.
Then, since the goal is so far down the road, we often focus solely on achieving a better metric value, and we lose sight of the goal.
We become obsessed with improving a metric and actually hamper progress toward the goal. This can happen because the situation is more complex than we comprehend: there are often myriad factors that must align for us to reach our goal. Thus, focusing single-mindedly on a metric, and ignoring any other factor, can lead to improving the metric at the expense of the ultimate goal.
The above is one way to understand the insight that these three researchers raise:
Observations of Metric–Goal Distortion in Economics, Sociology, & Anthropology
“Any observed statistical regularity will tend to collapse once pressure is placed upon it for control purposes.”—Economist Charles Goodhart (1975)
“The more any quantitative social indicator is used for social decision-making, the more subject it will be to corruption pressures and the more apt it will be to distort and corrupt the social processes it is intended to monitor.”—Sociologist Donald T. Campbell (1979)
“When a measure becomes a target, it ceases to be a good measure.”—Anthropologist Marilyn Strathern (1997)
Goodhart observed this peculiar metric–goal relationship in his study of British monetary policy. Campbell and Stathern saw a similar pattern in British universities.
Metric–Goal Distortion in the Education System
Let’s consider Stathern’s thesis for a moment. In a 1997 paper ‘Improving Ratings’: Audit in the British University System, she traces the introduction of the modern school grading system to British universities in the 18th century. And she suggests that this novel grading system started a cycle of focusing on metrics to the detriment of goals.
The Introduction of Numerical Grades
Numerical values were first assigned to students’ performance in the late 1700s (what we might recognize today as the practice of assigning grades from 100 to 0, with their attendant letters A to F). Universities wanted a way to tell how their students stacked up against those of other universities. So standardized written exams were created and used across the university system. And these exams were evaluated in line with the strictures of the new numerical grading rubric.
Now universities could calculate how well their students performed, and thus garner more esteem as an institution for moving up the numerical ranks. Something is missing from such a calculation, however: how students went on to perform after graduation. Were better exam marks correlated with higher income? Better quality of life? Did the university prepare students to flourish? These sorts of sticky questions are just what we lose sight of when a metric becomes the focus, rather than the goal.
From Students to Teachers
Strathern’s analysis has been extended to point out subsequent metric-goal distortions in the education system that go beyond the evaluation of just students. Teachers and their methods have been brought under the umbrella of numerical metrics.
In recent decades standardized curricula, tests, and achievement goals have been introduced into the American education system, especially with initiatives like the No Child Left Behind Act.
With such objectives in place, many schools began evaluating teachers based on the performance of their students on the new standardized tests. Schools would track how students scored on standardized tests over the course of the school year and as they progressed through grades from year to year. Then schools could calculate a numerical value for how much a teacher had improved her or his student’s performance; this calculation was then a factor in giving raises and conferring tenure.
Teaching to the Test
Consequently, the phenomenon of “teaching to the test” arose. Teachers who stuck strictly to the prescribed curriculum were more frequently promoted under this system. While teachers who deviated from set lessons to perhaps provide a more holistic presentation of a subject could end up with students who scored lower on the standardized test, and thus be passed over for promotions or raises, even though their students got a well-rounded education.
A Negative Feedback Loop in the Education System Resulting from Metric–Goal Distortion
So the focus of the education system has shifted. The focus was (presumably) originally to prepare students to be flourishing members of society—the goal. The focus has now often become tracking how closely teachers stick to mandated curriculum—a metric—with points docked for the slightest deviation.
Lessons from this metric–goal distortion can be applied to business generally and digital marketing specifically.
Metric–Goal Distortion & Quick Email Replies
Requiring prompt responses to emails can have unintended consequences.
Observation of Good Performance
Tom works for Yoyodyne. He does work that pleases clients. Each year Yoyodyne solicits performance reviews from clients. Clients complete reviews of Yoyodyne in which they praise the company for its work and mention how promptly Tom answers emails.
Setting a Metric of that Good Performance as a New Achievement Standard
Yoyodyne then makes it a policy that everyone must answer emails within 1 hour of receiving them.
Yoyodyne employees (conscientious as they are) begin checking their email about every 15 minutes to ensure they see any email quickly and have time to answer it before the hour elapses. And thereby they comply with the new rule.
This quarter-hour checking practice has ramifications.
Unintended Consequences of Aiming at a Metric Loosely Related to the End Goal
Clients receive prompt replies and send further requests more frequently as they learn how responsive Yoyodyne employees are. Employees end up doing a lot of work that is beyond the scope of the contracts between Yoyodyne and its clients.
In an effort to adhere to the new email rule, some employees develop canned responses that can be sent quickly. Doing so allows employees who are harried by a mass of emails to comply with the policy. However, clients start to feel that their requests are not being listened to or that their concerns are not being addressed with the appropriate specificity.
After a year under the new policy, Yoyodyne solicits another round of client reviews. The reported quality of the work that Yoyodyne delivers has dropped 20% compared to the previous year. Scrutinizing the reviews closely, Yoyodyne finds that a majority of clients commented on a particular kind of work. Work that requires sustained cognitive engagement over indefinite amounts of time—brainstorming, writing narrative reports to illuminate data, developing strategy plans—was reported to be lackluster.
Negative Outcome Brought to You by Goal–Metric Distortion
By focusing on one characteristic (prompt email replies) that accompanied good performance (positive client reviews), Yoyodyne improved a metric (email response time) to the detriment of its goal (client satisfaction).
Metric–Goal Distortion in a Push to Increase Content Output
Noting exceptional performance and then setting a measure of that performance as the new goal can be detrimental.
Noting Good Performance
Alex is a blog writer. Sarah manages the company’s content output. One week Alex pushes out 3 blogs; analyzing that week’s performance for the company site, Sarah sees an uptick in weekly organic traffic attributed to the blogs, as well as an uptick in in-bound leads from contact-us forms embedded in the blog.
Setting a Metric as the New Goal
Sarah praises Alex for his fine work and sets a new goal for him: to write 3 blogs a week from then on (where previously Alex’s remit was 1 per week).
Over the next couple of weeks, Alex hits this new 3-blog-per-week target. Sarah keeps an eye on the numbers and finds that none of the recent weeks compare to the first (to the week before the new goal was laid down).
Negative Ramifications of Hitting a Metric Target
Organic traffic trailed off in the 3rd and 4th weeks especially. In-bound leads stayed about the same over the whole period, but their quality was best during that initial week that Alex put out 3 blogs.
Sarah meets with Alex to discuss. It turns out that Alex has been feeling harried about meeting the new goal. He’s ended up working overtime and writing on topics that aren’t in his wheelhouse; he’s written blogs that he’s not so proud of just to reach the numerical goal.
Metric-Goal Distortion Leads to Sacrifice of Quality in Favor of Quantity
The quality of the company’s blogs has declined. One metric (writing 3 blogs/week rather than 1/week) that was associated with the furthering of the ultimate goal (qualified leads) was optimized to the detriment of the ultimate goal.
Spending a week crafting a single, robust piece of content may serve your goal better than pushing the pace in order to publish more frequently. Focusing on metrics can lead to a sacrifice of quality in favor of quantity.
Metrics and Their Components
As digital marketers, we observe and analyze various metrics…
- CTR (click-through rate)
- Conversion rate
- Impression share
- CPM (cost per thousand impressions)
- CPC (cost per click)
- Cost per conversion
- ROAS (return on ad spend)
…and their components:
- Impressions
- Clicks
- Conversions
- Revenue
Metrics—calculations of the component actions being tracked—are our attempts to treat marketing as a science. With these rates in hand, we strive to impose the order and clarity of a Euclidean proof upon our efforts to compel flesh and blood fellows to take action.
Metrics hold out the possibility of deriving a formula to reach one’s goal. The thinking might go something like this: “My campaign had a 2% CTR when it got its first conversion, so I need to maintain or increase that CTR to get another conversion.” This can lead to an over-emphasis on metrics rather than their components.
A word from the DOM team:

“Sometimes we can’t see the forest for the KPIs. Sometimes our clients, and we ourselves as marketers, focus on the averages more than individual data. If we get hyper-focused on one oak tree and help it grow into the best tree it can be, that’s great. But if all of the other trees around it are also doing well, we need to pay attention to that too. And we need to recognize that different types of trees require a different type of care to grow. Achieving a CTR of 3% is great, but if none of those clicks go on to convert, what’s the point. And, similarly, shooting for a 3% CTR in an awareness campaign might not even make sense. The point of those ads is to get your name out there, so impressions or views is a more relevant data point to keep track of.”
—Carl Zappa, Digital Advertising Account Manager
Metric–Goal Distortion & ROAS
At DOM, we advise clients to be wary of the seductions of ROAS.
Return on ad spend is often expressed as a calculation of conversion value (a.k.a. revenue) divided by the money spent to run the campaign that got that conversion (a.k.a. ad spend). So if you get a conversion worth $9 and you spend $9 on ads, you’ve achieved a ROAS ($9/$9) of 1. You broke even.
Consider two scenarios and their stats:
A
- ROAS=80
- Revenue=$17,000
- Ad spend=$212.50
- Conversions=5
- Cost per conversion=$3,400
B
- ROAS=20
- Revenue=$1,600,000
- Ad spend=$80,000
- Conversions=250
- Cost per conversion=$320
When you make ROAS your measure of success, you may miss out on revenue.
In A, the marketing team (or perhaps the Target ROAS bidding strategy of an ad platform) may be optimizing campaigns to sell the highest-ticket items for the least ad spend possible.
In B, a wide variety of items is advertised, resulting in more conversions at a wider variety of prices.
If you only knew the ROAS of A and B, you’d likely choose A. Luckily we live in a world awash with data, so we also know the bottom line of our marketing efforts: the revenue. And revenue is a component of the rates that can be so tempting to chase.
At the end of the day, it’s impressions, clicks, conversions, and revenue that define success. Not one of the plethora of metrics we’ve whipped up.
Avoiding Metric–Goal Distortion
So how do you break free from metric–goal distortion? Do you go to MA meetings (Metricholics Anonymous)? Do you swear never to even sneak a peek at a metric again?
No, not quite. We don’t recommend a cold turkey approach to curb a metric obsession. We do recommend taking a broader view of the variety of factors that contribute to marketing success.
A word from the DOM team:

“You would never go to a doctor who only ever looked at your left elbow and just ignored the rest of your body. Marketing should similarly not focus on just one area. Marketing is a holistic experience. You need to consider the different purposes that ad campaigns are aimed at. Some ads may be primarily for branding, others for awareness, while others may be trying to entice a purchase in the moment with a CTA like Buy Now! And so then you must evaluate the performance of each campaign based on its purpose. You can’t use the same measure of success for all your efforts.”
—Victoria Kurczyn, Senior Client Success Manager
Understanding Your Marketing Web
One way to get this broader perspective is to dive into Google Analytics. Take a look at top conversion paths, conversion path length, and assisted conversions.
Google Analytics > Top Conversion Paths
Top conversion paths reveals how marketing channels work together.
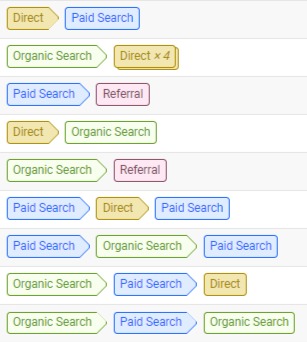
People frequently interact with your company in many ways before converting. Top conversion paths chart out user journeys. It shows you many ways that users may be coming to your site: organic search, paid search, direct traffic, referral traffic, email link, display ad, social network content.
With this info in hand, you can approach your marketing as a web rather than a straight line. People are enticed in different ways by different channels. They bounce around. They don’t tend to proceed on a logical, linear course from seeing one ad to directly making a purchase.
Google Analytics > Conversion Path Length
Path length shows how many times people interact with your site before converting.

This can give you insight into your sales cycle.
Here about half of all conversions and conversion value results from a single interaction between a user and your marketing. That leaves the other half where users take a more meandering (web-ish) path. Plus you can see here that about 10% of conversions and their value results from paths that are more than a dozen interactions long.
Fostering a robust marketing web can help you capture these long-path users. Give them multiple ways to learn about your product, and you may have a sale on your hands down the road.
Google Analytics > Assisted Conversions
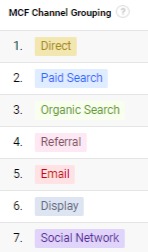
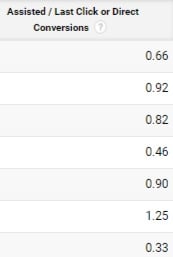
Assisted conversions helps you understand how much each channel drives conversions directly and how much each channel assists in driving conversions in other channels.

Assisting
2: Scores over 1 indicate that the channel functioned primarily in an assisting role.
Half & Half
1: A score of 1 signals that the channel functioned equally to assist in conversions as well as to drive conversions directly.
Converting
0: Scores closer to 0 mean that the channel functioned mostly as a direct driver of conversions, with less assistance along the way to the user’s final action.
This assisted conversion data helps you understand your marketing web better. It shows you how nodes connect to provide paths that users take and circle back on before deciding to convert.
Dig in further to assisted conversions with this blog.
Understanding Assisted Conversions: Your Silent Helper in Digital Marketing
Inside you’ll find actionable insights for common traffic sources:
- Direct
- Paid Search
- Organic
- Referral
Get Your Head Out of the Data-Clouds and Put Your Feet on the Ground
Another way to get a broader perspective is to actually talk to people.
Suss Out and Share Resources
See your social media manager humming along doing great work? Ask her what she does to keep up on that ambitious posting schedule. Maybe there’s a social media blog that she goes to for inspiration and to stay up to date on social advertising trends. Then you might bring that blog to the attention of others and spread the inspiration.
Solicit Constructive Feedback
Have a customer with a problem? Even, and perhaps especially, a former customer. Ask why they stopped using your product or service. Did a poor interaction with one of your team put them off? Was there a higher-quality product available for a comparable price? Dig into what stood out to them about your company. This kind of third-party feedback can help us realize things about ourselves that we might otherwise be blind to.
Think Holistically to Avoid Metric–Goal Distortion
Distortion of goals and metrics is a kind of negative feedback loop. A loop in which we focus on a single part of a process that sticks out, we try to optimize for that part, and then lose sight of the big picture.
Clickbait headlines come about from metric–goal distortion.
You want someone to take action. So you make your case in an article or email. And what’s something upstream of someone taking action that must always happen first: opening the email. So you start crafting outrageous headlines that bend the truth or cajole or scare people into opening.
This approach might get a lot of email opens; it’s unlikely to get many people to take the action you ultimately want.
How do you avoid metric–goal distortion?
There are no easy answers here.
We can, however, advise against single-mindedness and toward openness. Cast around for factors to which you may not be paying proper attention. There is much about how we got here that we do not understand. The particular situation in which we find ourselves is awash with forces beyond our understanding.
Still, we can set goals and make progress toward them. But we mustn’t lose sight of the fact that we are embedded in a rich world. We are neither likely to see each factor clearly, nor likely to appreciate the broad range of factors at play.
Opt for a holistic assessment of the situation. Not a narrow, metric-shackled approach.
Read on!
- Will AI Copywriting Replace Content Writers?
- Zero-click Searches and the Future of SEM
- How Online Marketing Helps Global Exporters Grow
Contact us for a free consultation. We’d like to understand your goals and see whether we can help you meet them.